Analytics for Construction Suppliers and Buyers
Analytics in BEEMESTA has two sides. On the dashboard, suppliers see demand for their products, catalog quality, their price position in the market and their clients. Buyers and estimators get the estimate by budget item with cost per m², project version comparison and snapshots of the project’s state.
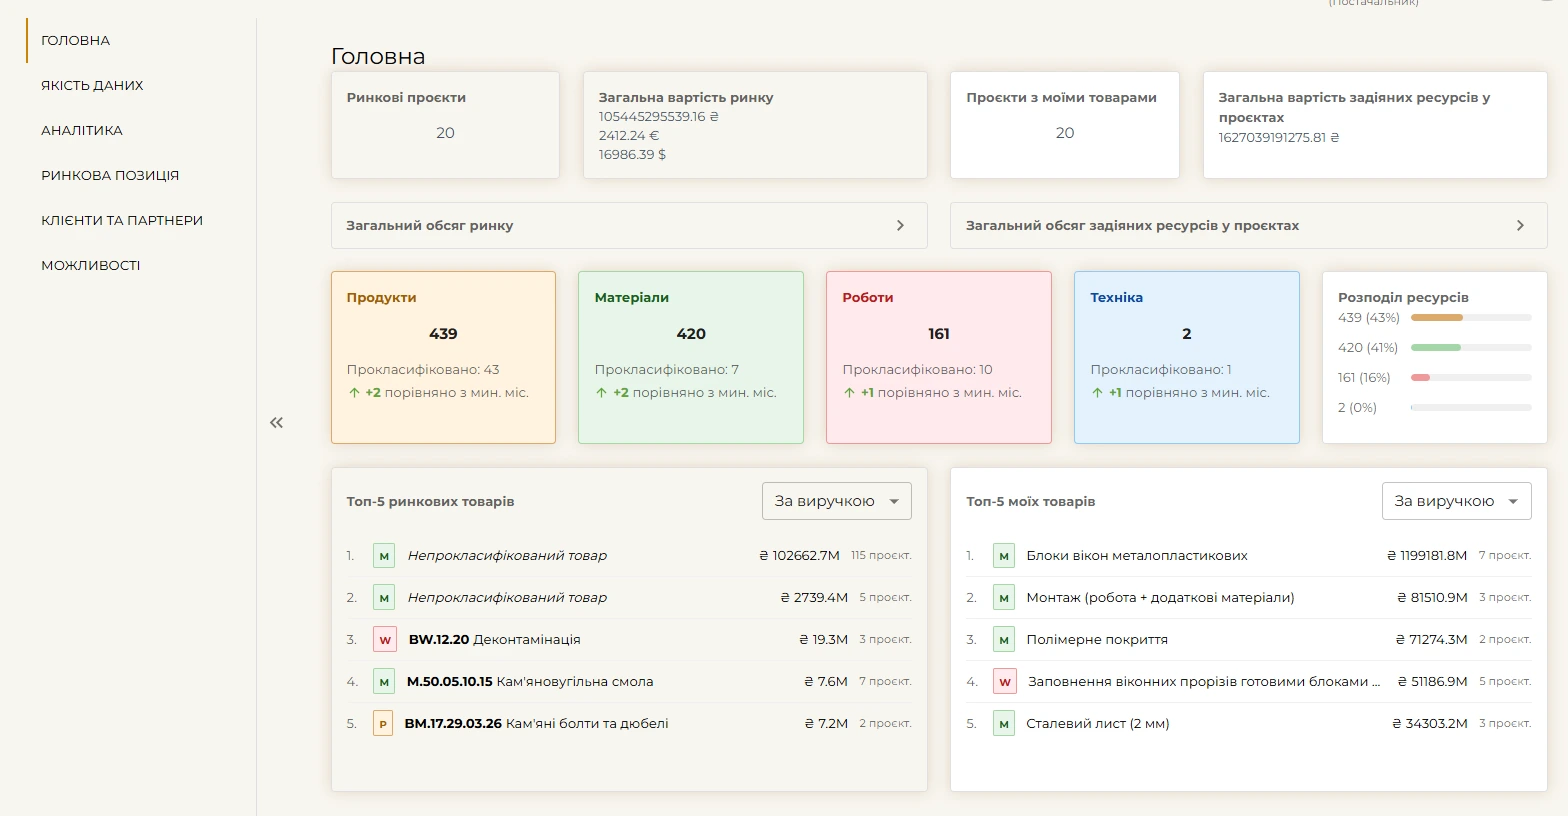
Supplier dashboard: demand, catalog quality, market and clients
The dashboard shows how a supplier’s catalog looks against the market and where orders are being lost. The “Market Projects” / “Company Projects” switch changes the scope of the figures, and the gap between the total market volume and the volume of your resources in projects is potential you haven’t tapped yet. Prices are compared only for classified products: the market average is calculated over the same classes, not by name.
- “Data Quality” — completeness of product cards, and products whose prices haven’t been updated in over 30 days
- “Analytics” — presence in projects and usage trends for your items
- “Market Position” — your prices next to market averages
- “Clients & Partners” — partnership agreements, project prices, partnership requests
- “Opportunities” — projects in planning and tenders
Estimate analytics for buyers and estimators
The “Budget structure” tab breaks the estimate down by item and section, with a currency switch and cost per m² — in the format a client expects to see. In the 3D viewer, the same totals are visible on the building elements, and tags break the cost down by floor, section or construction phase. The report also shows separately why an estimate is incomplete: elements without a class, classes without a formula, missing required classes for the stage.
For analysis over time, there are project versions, snapshots and the “Summary budget”, which combines several versions through their current reports. A comparison with snapshots is exported to Excel through the “Export Constructor”. In the “Formula Catalog”, the “Formula coverage” matrix shows which classes and stages still have no formulas, and grouping by “Budget items” shows how formulas are distributed across the budget.